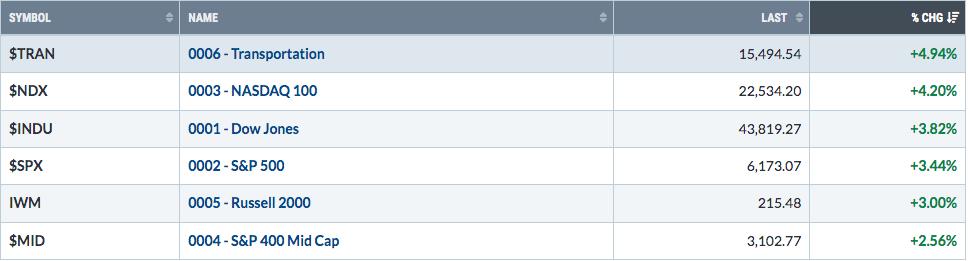
HomeCategory

Stocks

Quantum Stocks Explode: Why Traders Are Obsessed With QBTS and RGTI Right Now

If you regularly follow the SCTR Reports (StockCharts Technical Rank), you’ll notice that some top-ranked stocks aren’t just individual standouts but groupings that call attention to particular sectors, industries, or subgroups within the two. That’s exactly what happened Tuesday morning. A couple of high-ranking stocks pointed to a growing trend in the thematic subsector of quantum computing. Quantum Computing Stocks Light Up the SCTR Reports Occupying the top ranks of the Mid Cap SCTR Top...

S&P 500, Bitcoin & XLK: What the Charts Are Saying Now

In this video, Frank dives into some of his favorite features on StockCharts.com. He then dissects the S&P 500 and Bitcoin price action, before exploring the the XLK Technology ETF’s explosive move off the lows. He also highlights a few recent trade ideas and setups worth watching. Get trade ideas and chart setups worth watching in today’s technical review. This video originally premiered on May 20, 2025. You can view previously recorded videos from Frank...

Not All Price Gaps Are the Same! Here’s How to Trade Them

Learn how to analyze stock price gaps with Dave! In this video, Dave discusses the different types of price gaps, why all price gaps are not the same, and how you can use the StockCharts platform to identify key levels and signals to follow on charts where price gaps occur. Charts discussed include the S&P 500, First Solar (FSLR), Microsoft (MSFT), and more! This video originally premiered on May 19, 2025. Watch on StockCharts’ dedicated David Keller page!...

Earnings Watch: Smart Setups in HD, PANW, and BJ

Earnings season continues with names like Home Depot, Palo Alto Networks, and BJ’s Wholesale flashing signals that investors shouldn’t ignore. Whether you’re following home improvement trends, cybersecurity growth, or retail resilience, these stocks offer insight into where the stock market could be headed next. Let’s break down the charts, decode the earnings, and explore the setups that could shape your next move. DIY Boom Fizzling: What Home Depot’s Earnings Might Tell Us Home Depot, Inc....

The Best Five Sectors, #19

Sector Rotation Shakeup: Industrials Take the Lead Another week of significant movement in the sector landscape has reshaped the playing field. The Relative Rotation Graph (RRG) paints a picture of shifting dynamics, with some surprising developments in sector leadership. Let’s dive into the details and see what’s happening under the hood. (6) Industrials – (XLI)*(4) Financials – (XLF)*(1) Utilities – (XLU)*(2) Communication Services – (XLC)*(3) Consumer Staples – (XLP)*(8) Technology – (XLK)*(5) Real-Estate – (XLRE)*(9)...

S&P 500 Now in Weakest Seasonal Period… Or Is It?

We’ve all heard the classic market maxim, “Sell in May and go away.” For many investors, that’s the introduction to market seasonality that suggests a six-month period where it’s just best to avoid stocks altogether. Through my own experience, complemented with interviews with seasonality experts like Jeff Hirsch of the Stock Traders Almanac, I’ve learned to treat seasonal patterns as tendencies instead of certainties. Seasonal patterns tell you what is likely to happen, barring any external...

Emerging Stocks to Watch – Breakouts, Momentum & Upgrades!

Looking for breakout stocks and top market leaders? Follow along Mary Ellen shares stock breakouts, analyst upgrades, and sector leadership trends to help you trade strong stocks in today’s market. In this week’s episode, Mary Ellen reveals the stocks leading the market higher and explains what’s fueling their strength. She highlights base breakouts, analyst upgrades, and leadership stocks gaining momentum. In addition, she screens for emerging breakout candidates you should have on your radar. This...

The Stock Market’s Comeback: Key Takeaways for Investors

If you didn’t check in on the stock market the last couple of weeks, you might be surprised to see how strong they were this week. The three major stock indexes — S&P 500 ($SPX), Nasdaq Composite ($COMPQ), and Dow Jones Industrial Average ($INDU) — broke through their 200-day simple moving averages (SMAs) and are about 3–5% away from their all-time highs. The Dow took a bit of a hit early this week, mostly because...

SPY and QQQ Recapture their 200-day SMAs – Tips for Reducing Whipsaws and Improving Performance

SPY and QQQ crossed above their 200-day SMAs with big moves on Monday, and held above these long-term moving averages the entire week. The V-Reversal was extraordinary and SPY seems short-term overbought, but this cross above the 200 day SMA cross is a bullish signal for the most important market benchmark. Despite a bullish signal, long-term moving averages are trend-following indicators and it is important to set realistic expectations. ***** This is an abbreviated version...

Applying Dow Theory to Today’s Market: Are We in a Reversal or a New Trend?

For those of you who are a bit more steeped in technical analysis, you’ve likely heard of Dow Theory. A set of principles developed from Charles Dow, a journalist/analyst who founded what’s now the Wall Street Journal back in the late 19th century, Dow’s insight was foundational to modern technical analysis. Here’s a question: How can we view today’s market using Dow Theory’s six core tenets? The market seems to be turning around, especially after...