The Best Five Sectors, #26
21 hours ago8 min
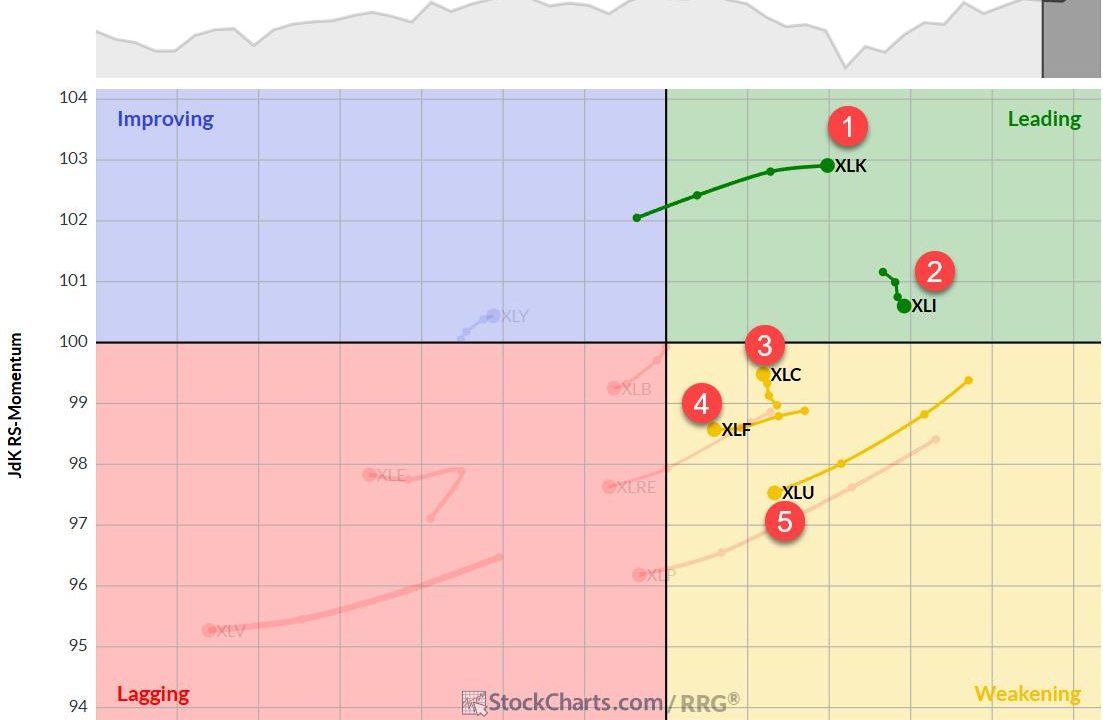
The past week has been relatively stable in terms of sector rankings, with no new entrants or exits from the top five. However, we’re seeing some interesting shifts within the rankings that warrant closer examination. Let’s dive into the details and see what the Relative Rotation Graphs (RRGs) are telling us about the current market dynamics. Sector Rankings Shuffle The top three sectors, technology, industrials, and communication services, remain firmly entrenched in their positions. But...